In the age of Industry 4.0, were technology drives civilization. Data-Driven is therefore extremely important for the management of various business organizations because if those data can be used to benefit and will have to go through an in-depth analysis process first. This is especially true when large volumes of Big Data are used, or complex information is used, as data analysis becomes more time consuming and difficult.
Nowadays, strategies are employed to provide information in a more understandable
style by transforming the data into graphics or Data Visualization, the reader will quickly comprehend what they want to say. Because the visual style information will aid in highlighting the important aspects of the material. Instead of keeping data in the form of documents or text, provide in-depth comparisons and fascinating bits of information to make them more visible.
As a result, Asst. Prof. Dr. Weerawan Chanthanasup, Lecturer in Data Science and Information Technology, and Mr. Suriyo Korwanichkul, Personnel Management Operations Faculty of Science and Technology Rajamangala University of Technology Phra Nakhon jointly conducted a study on increasing the efficiency of human resources work with a technology dashboard by offering tools to manage human resources data. With the technology of presenting information in an Interactive Dashboard.
According to Dr. Weerawan, interactive dashboards are technology tools that assist modern enterprises make choices. With insights, you can forecast current and future business situations. Business-critical data is automatically extracted from the company’s massive volumes of data and used to manage and visualize diverse data in the work that the business requires. It displays them in the form of charts or graphs on a user-interactive dashboard. Data presentation charts or graphs are intended to show information. Track changes in massive amounts of complicated data automatically in order to see the big picture, performance, and future trends. In terms of issue solving, the greater an organization’s capacity to grasp and use information effectively, the more effective it will be in organizing different elements of work. It is also a strategy and analysis tool. This research analyzes human resource data using advancements in dashboard technology. It wants to serve as a model for educational institutions with comparable features.
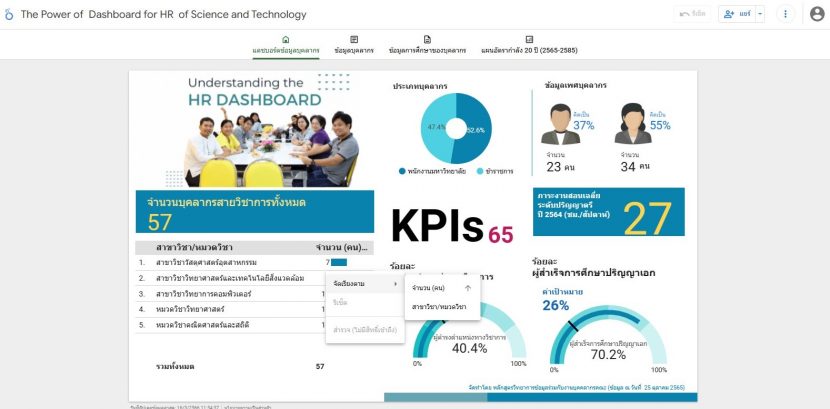
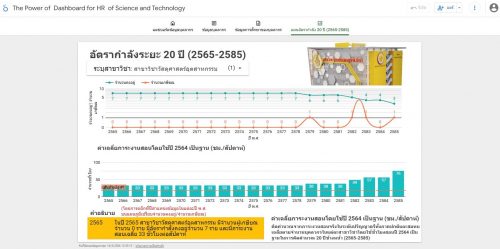
This study employs a case study based on data from academic employees at the Faculty of Science and Technology, which includes human resource data, personnel numbers, teaching workload data, success indicator data, and publication information. The data offered focuses on key performance indicators (KPIs), which include those in academic professions. Personnel with PhD degrees, for example, as well as data to assist long-term workforce planning. According to Dr. Weerawan, the Faculty’s human resource management activity has only been saved and collated in the form of data files. As a result, it is weak in the display of information in dimensions to aid decision-making in operations for planning, both in terms of personnel, operators, and executives. As a result, this study can assist the Faculty’s Human Resources Department in improving the recruiting process. Improve the management of success indicators while also boosting the overall efficiency of people work.
The dashboard development process consists of three major parts. 1) Connection Starting with data extraction from a website (Web Scraping) and progressing to formatting to be ready for presentation in the form of various charts. 2) Visualize, do analytics, and create visualizations of data dashboards. 3) Publish refers to the distribution of a dashboard to consumers.
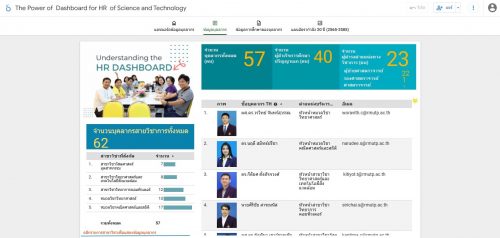
It has done a usability test in the faculty of 30 persons by assessing satisfaction with the target population. According to the test findings, the generated HR data dashboards are displayed in several types of charts that are both beautiful and simple to use. Satisfied with its usage at the highest level, and discovered that it may be utilized as a tool to aid staff management in. In order to provide assistance with long-term workforce planning and allows users to search for personnel names in each department within the Faculty to learn about the evaluation value of the index personnel success and the overall manpower information of departments, departments, departments, and faculty levels. “Dashboards are another tool that may be used to aid with work. By incorporating current technology into organizational management, you may obtain a strong picture of your firm as well as comparative viewpoints. “Interested people can seek for additional information at tel. 0 2836 3000 ext. 4211, stated Dr. Weerawan.